Even the best-designed B2B manufacturing and industrial sales metrics sales strategy can fall short without measurable insights to gauge its effectiveness. Tracking the right B2B sales metrics is essential for understanding and optimizing your approach. Metrics such as customer acquisition cost for manufacturing companies, buyer churn rate, and average lead response time reveal the true impact of your efforts. These quantifiable data points not only highlight performance but also provide actionable insights to refine your strategy. By monitoring key metrics like pipeline velocity and customer lifetime value, your sales team can identify areas for improvement and maximize success.
In the key accounts in the manufacturing space and the manufacturing and industrial sectors, having measurable insights into your sales strategy is critical for long-term success. Tracking the right sales metrics not only highlights your performance but also provides actionable insights to refine your approach. From understanding customer acquisition costs to reducing buyer churn rates, these metrics help you make informed decisions that directly impact profitability. Let’s explore the seven essential sales metrics that industrial businesses should prioritize to optimize their sales strategy. Here are seven essential B2B sales metrics every company should track to enhance performance and drive growth.
1. Customer Acquisition Cost (CAC)
Understanding your customer acquisition cost is vital for controlling expenses and improving profitability. CAC reflects how much your B2B company spends to acquire each new customer. For instance, if your marketing and sales team spends $10,000 to acquire 200 customers, the CAC is $50 per customer. Tracking this metric helps assess the cost-effectiveness of your sales and marketing campaigns, allowing for smarter budget allocation.
Understanding CAC is critical for controlling expenses and improving profitability in the industrial sector. CAC reflects the cost of acquiring new customers, whether through marketing campaigns, trade shows, or outbound prospecting.
Example:
If your company spends $20,000 on a campaign targeting manufacturing plant managers and gains 100 new customers, the CAC is $200 per customer. By monitoring this metric, you can identify which marketing channels provide the highest ROI and allocate budgets more effectively.
Pro Tip: Leverage SalesLeads’ Project Reports to reduce CAC by focusing on pre-qualified leads in industrial and manufacturing markets.
2. New vs. Returning Buyers
Tracking the ratio of new versus returning buyers can help you balance customer acquisition with retention. Research shows it’s five to seven times more expensive to acquire a new customer than to retain an existing one. By understanding the percentage of returning buyers in your sales funnel, your B2B sales team can develop strategies to nurture loyalty while attracting fresh leads.
Balancing customer acquisition and retention is vital for sustainable growth in manufacturing. Research shows that retaining existing buyers is significantly more cost-effective than acquiring new ones. Tracking the ratio of new vs. returning buyers helps you identify opportunities to nurture loyalty while targeting fresh prospects.
Example:
If 70% of your revenue comes from repeat customers, invest in personalized after-sales services and maintenance contracts to strengthen those relationships.
3. Average Revenue Per Account (ARPA)
ARPA provides insights into how much revenue each customer generates within a specific period. Higher average revenue per account indicates effective cross-selling or upselling tactics. Monitoring this metric empowers your sales team to maximize value from existing customers, aligning efforts to drive B2B revenue growth.
ARPA measures the average revenue generated per customer over a specific period. Industrial companies can use this metric to evaluate the effectiveness of cross-selling and upselling strategies.
Example:
An industrial equipment supplier could track ARPA to assess the impact of offering add-ons like service warranties or spare parts.
Pro Tip: Focus on high-value accounts in industries like material handling or manufacturing automation to maximize ARPA.
4. Average Lead Response Time
Time is a critical factor in converting industrial sales leads. The average lead response time measures how quickly your team follows up with prospects. Faster response times significantly increase conversion rates, as decision-makers in manufacturing often operate on tight timelines. Delays, on the other hand, can lead to prospects opting for competitors. Optimizing this metric ensures your team capitalizes on high-quality B2B sales leads effectively.
Example:
A delay of just 24 hours in responding to a lead for a facility expansion project could result in losing the opportunity to a competitor.
Pro Tip: Use tools like SalesLeads’ industrial Project Reports to streamline follow-ups and improve response times.
5. Pipeline Velocity
Pipeline velocity measures how quickly leads move through the sales funnel, from initial contact to conversion. In the manufacturing sector, shorter sales cycles indicate an efficient process. Shorter cycles indicate efficiency in converting leads into customers. Tools like SalesLeads’ industrial project reports can provide valuable insights to accelerate pipeline movement, helping materialize opportunities faster.
Example:
Tracking pipeline velocity for high-value opportunities, such as plant renovations or equipment upgrades, ensures your team can close deals faster.
Pro Tip: SalesLeads’ Project Reports can provide critical insights to accelerate pipeline velocity by offering detailed data on industrial projects.
6. Customer Lifetime Value (CLV)
CLV calculates the total revenue a customer is expected to generate over their relationship with your business. This metric is particularly valuable in manufacturing, where long-term contracts and repeat purchases are common. This metric helps balance customer acquisition cost with long-term profitability. Tracking customer lifetime value enables your sales and marketing teams to identify high-value accounts and tailor strategies for retention and growth.
Example:
A buyer purchasing $1M in industrial machinery over five years represents a high CLV. Tailoring your retention strategies ensures you maximize the value of this relationship.
7. Buyer Churn Rate
Finally, tracking buyer churn rate is critical to maintaining a sustainable customer base. This metric reveals the percentage of customers who stop doing business with your company during a specific period. A high churn rate signals the need for improved after-sales service, loyalty programs, or better alignment of products and services to customer needs.
Buyer churn rate reflects the percentage of customers who stop doing business with your company during a specific period. A high churn rate in the industrial sector often signals issues like inadequate after-sales support or misaligned services.
Example:
If you notice an uptick in churn among buyers of HVAC systems, consider enhancing maintenance and training programs to address their needs.
Pro Tip: Incorporate follow-ups and personalized outreach to reduce churn and strengthen relationships.
The Role of SalesLeads in Optimizing Your Metrics
Integrating tools like SalesLeads’ Project Reports can enhance your B2B sales performance by providing high-quality leads and insights into potential projects, such as facility expansions, relocations, and renovations. These detailed reports include key contact information, ensuring faster lead response times and enabling more meaningful conversations. By using SalesLeads’ industrial marketing services, your team can focus on nurturing sales-qualified leads while achieving measurable improvements in pipeline velocity and customer acquisition costs.
Tools like SalesLeads’ Project Reports can enhance your sales performance by providing high-quality, pre-qualified leads tailored to the industrial and manufacturing markets. These reports include detailed insights into projects like facility expansions, equipment upgrades, and plant relocations, helping you:
-
Improve lead response times.
-
Identify high-value opportunities.
-
Optimize CAC and pipeline velocity.
Finally, you can use these sales and marketing metrics for all of the sales leads, which will produce a result, and you can also measure it by marketing and sales programs. In order to understand which marketing channel is producing the best results including close rate, track your sales leads by program. Be sure to include SalesLeads in your sales channel for sales leads as it provides identified projects. These SalesLeads Project Reports already give you the summary of the project along with alerting you to what opportunities are within the company. This will certainly affect the customer acquisition cost, average return per account, and average lead response time. Learn more about it.
Tracking these essential B2B sales metrics—alongside traditional ones like monthly and yearly sales—provides a robust framework for assessing performance. With focused efforts and data-driven strategies, your company can refine its sales and marketing processes, ensuring long-term growth and success, and check out SalesLeads prospecting services.
In Conclusion
By tracking these essential sales metrics tailored to the industrial and manufacturing sectors, your company can refine its strategies, reduce costs, and drive sustainable growth. Metrics like CAC, CLV, and pipeline velocity provide the foundation for smarter decision-making, ensuring your sales team operates efficiently and effectively.
Investing in data-driven insights, leveraging tools like SalesLeads’ Project Reports, and optimizing internal processes will set your business apart in the competitive industrial market.
Want a predictable flow of qualified leads?
Let’s talk about how we can build it for you.
Latest Posts
-
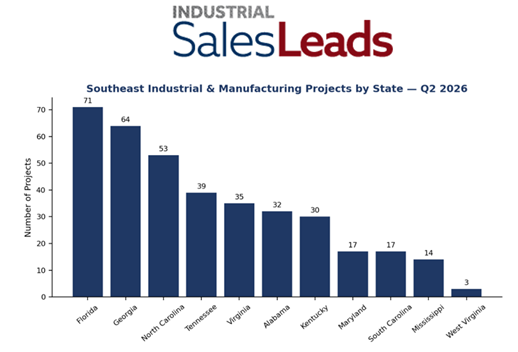
New Industrial, Manufacturing and Supply Chain Facility Projects Signal Sustained Capital Investment Across the Southeast in Q2 2026
-

13 New Chemical and Industrial Manufacturing Projects Signal Continued Capital Investment in June 2026
-

12 New Pharmaceutical, Biotechnology, and Medical Device Projects Include $1 Billion J&J Facility in June 2026
-
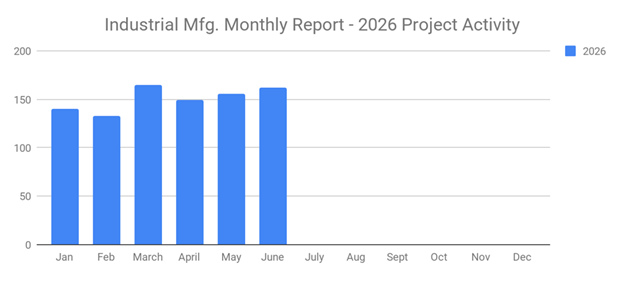
Industrial Manufacturing Sector Posts 8.72% Q2 Growth as June Planned Projects Reach 162
